



Overview
InRhythm, Inc. developed an enterprise Business Intelligence platform tailored for the CPG supply chain, serving distributors, manufacturers, and retailers. However, the platform suffered from a legacy trap: it was highly technical, heavily reliant on dense static desktop dashboards, and struggled to perform efficiently in modern web browsers.
As the Principal UX Architect, MCD led a comprehensive modernization initiative. The objective was to transform this legacy system into a fast, responsive, web-native experience that bypassed traditional dashboard gridlocks by introducing Natural Language Processing and Machine Learning driven capabilities.
The Challenge
Before the design overhaul, the platform faced critical user experience and structural bottlenecks:
- Cognitive Overload Users were bombarded with dense walls of data. Finding actionable supply chain insights required deep technical knowledge and manual filtering.
- Browser Performance Degradation The legacy architecture could not handle rendering large datasets smoothly in modern browsers, leading to lag and interaction friction.
- The Crutch of Help Systems The software was complex enough that users frequently relied on documentation, user guides, and training just to generate standard reports.
- Static Visualization Dashboards showed what happened in the past but failed to deliver intuitive, real-time, or predictive stories.
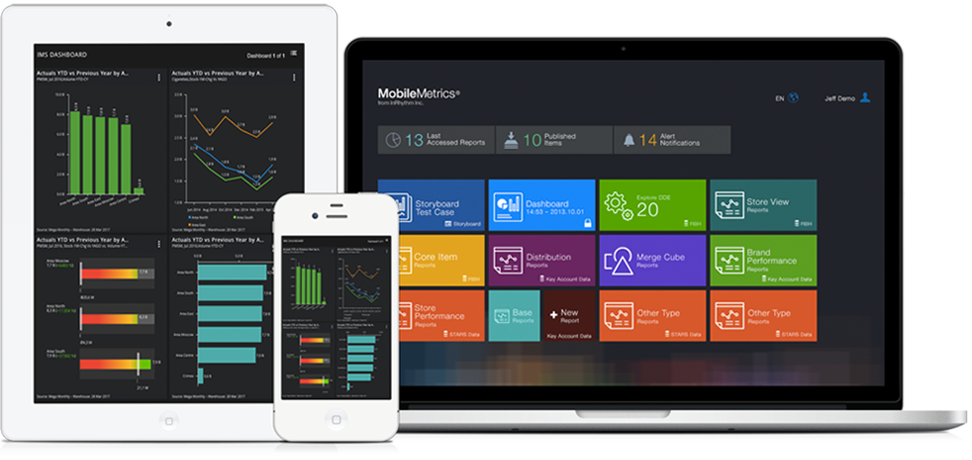
Vision: Dashboarding to a Virtual Analyst
The core design strategy shifted away from traditional crowded charts toward an intelligent conversational interface. The vision was to design a platform that transcended simple data visualization, creating a voice-driven virtual data analyst using NLP and Natural Language Generation.
Instead of building complex queries, a CPG manager could simply ask the system a question as if they were talking to a human analyst.
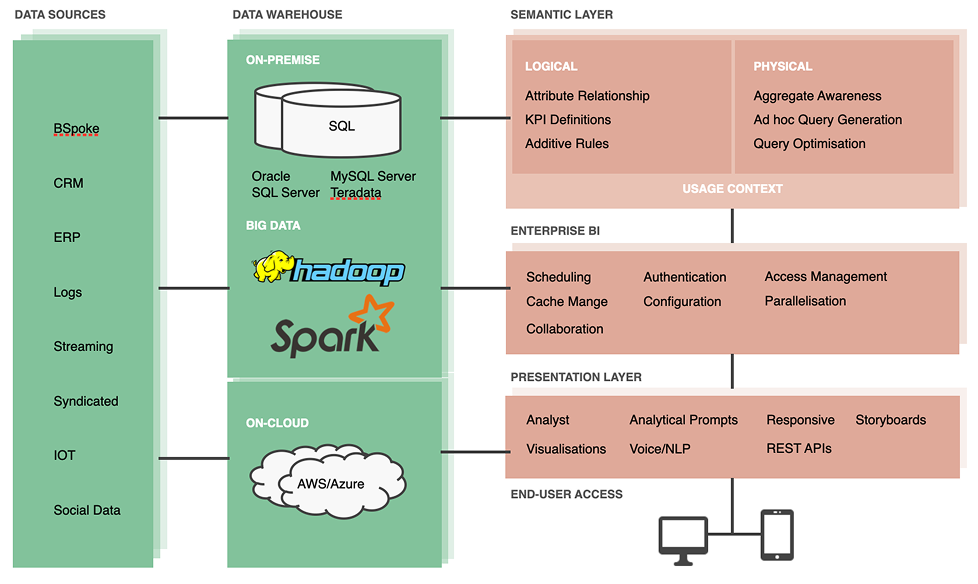
Modernization Method
MCD’s modernization process focused on making complex supply chain data usable at enterprise speed. The strategy was to reorient the platform around simpler language, lightweight browser performance, and interfaces designed for real workflows rather than technical database structures.
- Context Mapping & User Research Phase 1 Conducted contextual interviews with key CPG personas to map daily workflows and shift the focus from abstract user groups to real logistics decisions.
- Information Architecture & Jargon Removal Phase 2 Stripped out technical database jargon and redesigned layouts to prioritize scannability, clarity, and clear affordances.
- Designing the Conversational NLP Workspace Phase 3 Architected a clean browser interface centered around search and voice interaction, including graceful handling of ambiguous data requests.
- High-Fidelity Prototyping & Usability Tune-Up Phase 4 Created responsive web-native prototypes using modern patterns and optimized them for rapid loading and seamless browser interaction.
Key UX Transformations
Legacy BI State
Dense data grids
Manual filter chaining
Static chart overload
Modernized Platform State
Conversational NLP input bar
Voice and natural language querying
Predictive insights and text summaries
- Natural Language Integration Instead of manual filtering, users could type or speak natural-language questions such as which distributor carries the highest shipping-delay risk next week.
- Storytelling Over Explaining Using Natural Language Generation, the system automatically surfaced short summaries alongside charts so users understood why a metric shifted.
- Modern Web Infrastructure Adaptability The UI direction used flexible design systems that adapt dynamically to feedback while staying lightweight and fast in the browser.
Key UX Transformations
- Eliminated the Crutch The self-explanatory interface drastically reduced reliance on onboarding help systems and documentation.
- Massive Performance Optimization Streamlined browser rendering allowed supply chain managers to interact with large datasets more smoothly and with less lag.
- Competitive Differentiation Positioned InRhythm ahead of legacy BI competitors by turning static dashboards into a more active, predictive virtual workspace.
- Increased Product Adoption The cleaner, consumer-grade UX led to higher engagement from executives who previously found the tool too technical to use without an analyst present.
- Design Principle Applied Less is more when solving a complex data problem. Strategic vision and enterprise UX should make the system intuitive, predictable, and highly adaptable.